
Clustering is very famous in unsupervised learning. Clustering is the task of grouping observations such that members of a cluster are similar to each other.
In case of supervised learning classes are defined from different labels but in clustering classes are determined by how varied features does the data have.
Clustering might reveal two groups and it may also reveal four groups on the same data.
Clustering is generally used to explore a dataset. Clustering can be used to find related books, it may be used to find related music etc.
The very famous recommendation systems also uses clustering.
K-Means is a very famous clustering algorithm as it is very fast and scalable. K-Means clustering iteratively move the centers of different clusters i.e. centroids, to the mean position of their constituent points and again clustering according to new centroids.
The K in K-means clustering is a hyperparameter that specifies the number of clusters to be created. This algorithms automatically assigns an instance to a cluster but it cannot determine the optimal value of K.
K must be a positive number that must be less than total number of instances in the training dataset. Most of the time K is chosen as per business requirement/problem’s context. For example, an ice cream company might be planning to launch three new flavours. To understand what group of customers to target with each flavour, it creates three clusters. In this case K is determined by problem context.
The parameters that are to be learned in K-means are the centroid value and the instances assigned to each class, that are optimized by minimizing the cost function.
The cost function:
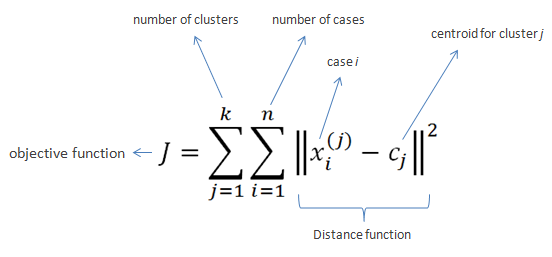
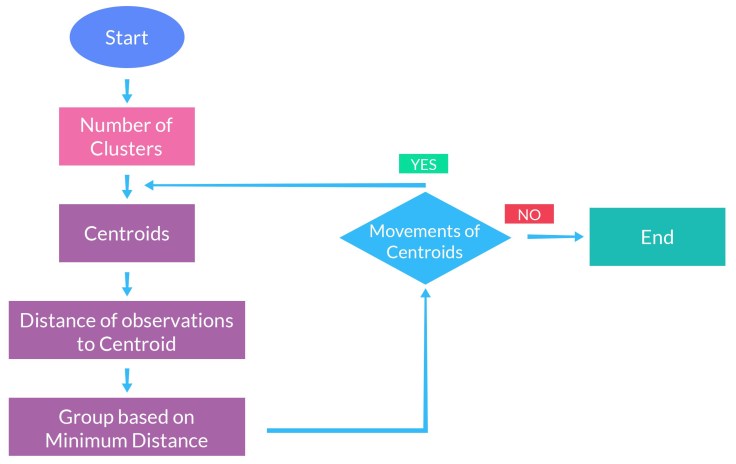
In the process of K-means clustering firstly K centroid are randomly selected as in practical case random selection of K provides the best result. After that distance of each instance is calculated with each centroid and the instances are assigned class of the centroid which is closest to it. Then in the subsequent iterations the centroid is calculated as the mean of each class framed in previous iteration. This process will continue till n number of iterations. But after convergence there would not be any change in class assigned to the instances.
If the n i.e. stopping criteria is too small then K-means could also stop at local optima instead of global optima.
How to select optimal value of K?
If K cannot be specified by the problem’s context then the optimal number of clusters can be determined using elbow method.
The elbow method plots the value of the cost function produced by different values of K. As the value of K increases, the average distortion will decrease; each cluster will have fewer constituent instances, and the instances will be closer to their respective centroids. But after some increments of K the improvement of average distortion will decline. The value of K at which the improvement to the distortion declines is known as elbow and this elbow is used as an optimal value of K.
Example: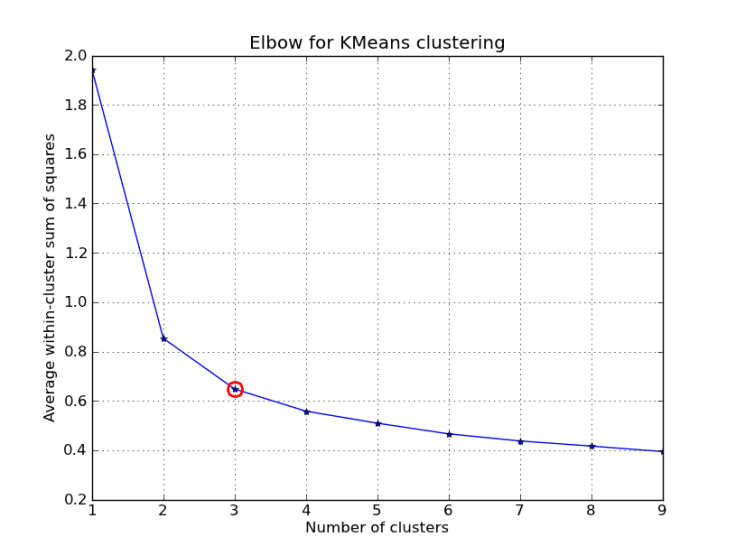
So, in the above figure the improvement in distortion starts decreasing after 3 clusters so 3 would be selected as the value of K.
How to evaluate the performance of clusters?
After selection of number of cluster we need to ensure that out selection will result in an optimum solution. To check the performance we have a cluster performance metric known as silhouette coefficient.
The silhouette coefficient is a measure of compactness and separation of clusters i.e. it will measure how tightly clustered our instances are.
It is very useful in selection of optimal value of K. It is large for compact clusters that are far from each other or clearly separated and it is small for large, overlapping clusters.
The silhouette coefficient is calculated per instance. For a set of instance, it is calculated as the mean of the individual samples’ score.
The silhouette coefficient for an instance is calculated with the following equation:
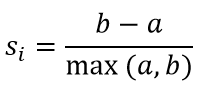
Here, a is the mean distance between the instances in the cluster and b is the mean distance between the instance and the instances in the next closest cluster.
Example:
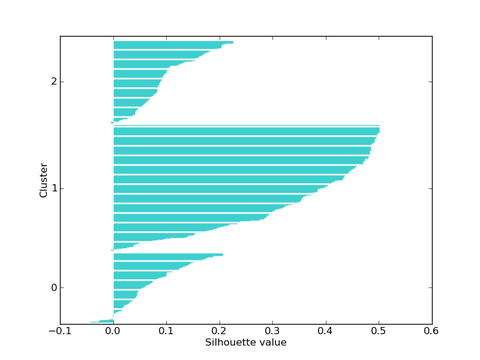
In the above figure when having number of clusters as 1 results in the maximum value of silhouette coefficient. So, the 1 would be selected as the optimal value of K.
Follow for more such updates! Happy reading!

Leave a comment